


Alternative to traditional Gage R&R metrics for the pharmaceutical industry
Author(s): Thomas de Marchin (Senior Manager Statistics and Data Sciences at Pharmalex), Laurent Natalis (Associate Director Statistics and Data Sciences at Pharmalex), Tatsiana Khamiakova (Associate Director Manufacturing and Applied Statistics at Janssen), Eric Rozet (Director Statistics and Data Sciences at Pharmalex) and Hans Coppenolle (Director Manufacturing and Applied Statistics at Janssen). This article was originally presented at the conference NCB 2021.
[dt_divider style=”thin” /]
Introduction
Gage R&R studies are often conducted in the industry to determine the operating performance of a measurement system and determine if it is capable to monitor a manufacturing process. Several metrics are commonly associated with Gage R&R studies, such as the precision-to-tolerance ratio (P/T), the precision-to-total-variation ratio (%RR), the Signal to noise ratio (SNR), the %Reproducibility and the %Repeatability. While these metrics may suit well the overall industry, they could be problematic once applied in drug manufacturing sector for several reasons, (1) (bio)pharmaceutical assays are often more variable than common physico-chemical measurement systems and the usual criteria are too restrictive for the pharma industry, (2) analytical methods cannot always be improved once qualified, and (3) measurements are usually costly and time consuming, which makes difficult to have enough data to estimate all sources of variance with high precision.
All the above-mentioned difficulties often lead to blame the measurement system and trigger alarms, while the quality of the measurements might be acceptable for its intended purpose. Moreover, it is often difficult to figure out how to interpret the most used Gage R&R metrics, which lack strong mathematical rationale[1] and because they typically do not consider uncertainty of the estimates.
The objective of this work is to propose an alternative way adapted to drug manufacturing to investigate whether the measurement system is acceptable for its intended purpose. Our approach focuses on understanding the properties of the measurement system and aims to answer the only relevant questions: (1) Is my measurement system able to discriminate good and bad batches? (2) Will future batches meet the specifications, given the process and measurement variabilities investigated in the Gage R&R experiment?
Data
GAGE R&R DATA
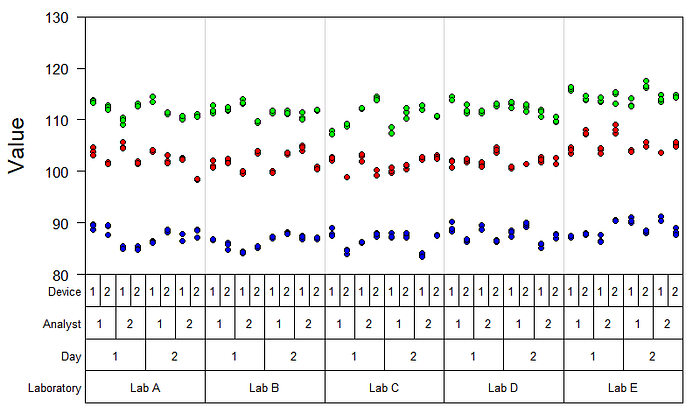
In a typical Gage R&R context, several batches are repeatedly measured by different analysts on different days using different equipment and, in some cases, in different laboratories. Gage R&R data were simulated:
CPV DATA
While Gage R&R data is usually used to provide information about the measurement system and the process variabilities in the overall industry, process variability cannot be estimated correctly from this data in the pharmaceutical context. Indeed, only a limited number of batches (3–5) are usually measured. Moreover, extreme batches are usually selected to span the specification range and are therefore not representative of the process effective batch-to-bath variability.
On the other hand, process variability might be estimated from other sources such as is Continued Process Verification (CPV). In CPV, each CQA is measured for each batch and monitored across time to verify if the process is remaining under control. A typical CPV dataset was simulated and graphed with its specifications ([90–110%]:

Results
From the Gage R&R dataset, it is possible to estimate the measurement system variability and calculate different metrics. The following model has been fitted to the Gage R&R data using a Bayesian framework with the R package brms:
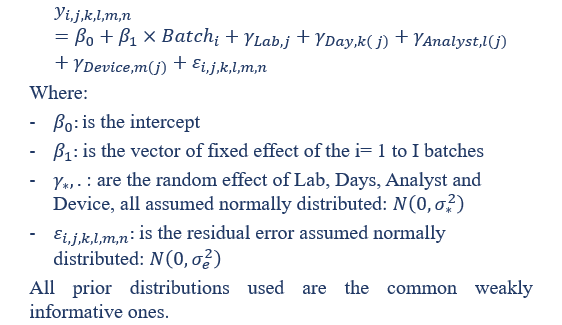
The main advantages of using a Bayesian methodology are (1) it takes into account the uncertainties related to models and parameters values, (2) it is predictive and make it easy to simulate future measurements by simulation and (3) it is possible to incorporates relevant prior probabilities, which is useful when data available are limited.
The following metrics can be computed from the Gage R&R dataset:
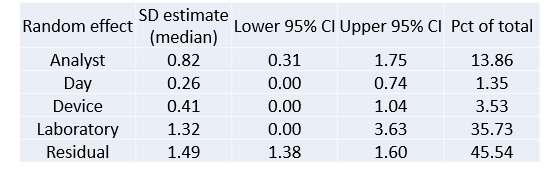
a) Relative contribution of each component (variance component analysis)
b) Single and Multiple laboratory precisions (uncertainty of measurement). A result of X±Y means that there is 95% chance that a future measured value will be ±Y around the true value X.


c) Probability of success to be within specification as a function of the batch true value. This plot help to determine a “safe region” where the true batch values should lie to ensure a high probability to meet the specifications, given the measurement error.
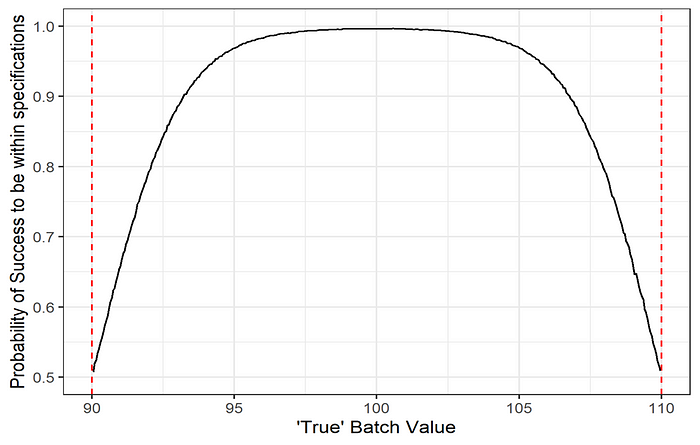
While these metrics are useful to assess the measurement system, it does not incorporate the actual process variability but rather let the evaluator decide if the process variability is small enough to operate in the “safe region”. Is it possible to combine both measurement and process variability to determine if future batches will meet the specifications?
To answer this, we can leverage CPV data to determine the process variability. CPV data usually consists in only one measurement per batch, making it difficult to discriminate the process and measurement variability.
To discriminate both, we used a prior on the measurement error calculated from the Gage R&R fit. This prior has been determined using all random effects of the Gage R&R fit, except the laboratory-to-laboratory one as the CPV data comes only from a single laboratory. The following model has been fitted to the CPV data using a Bayesian framework with the R package stan:

From there, results were predicted for the different laboratories using (1) The batch-to-batch variance and batch intercept posterior distributions from the CPV model and (2) The run-to-run variance, residual variance and laboratories effect posteriors distributions from the Gage R&R model
The figure below shows the posterior predictive distribution of future measured batches in the different laboratories. We see that most laboratories will likely produce measurements within specification, except Lab E which measures higher than other laboratories. We can then compute the probability of success to be within specification. Lab.A=0.98; Lab.B=0.98; Lab.C=0.99; Lab.D=0.98; Lab.E=0.93. This allows to determine which laboratories are able be perform measurements with a good probability of success and to potentially investigate the problematic laboratories.

Conclusions
We used a Bayesian framework to combine knowledge of the measurement system properties with knowledge of the process variability. The metrics proposed here facilitate the interpretation of the results, compared to the traditional Gage R&R metrics. This example shows the advantage and flexibility of using a Bayesian framework to determine if the measurement system and the process are capable.
References
- Wheeler, Donald J. “An honest gauge R&R study.” Manuscript 189 (2009).
- https://www.r-bloggers.com/