


Back-PredicteR — An Easy-to-Use Shiny Application for Back Prediction of Analytical Method Signals to Concentrations
By Thomas de Marchin (Associate Director Statistics and Data Sciences at Pharmalex).
Thomas is Data Scientist at Pharmalex. He is passionate about the incredible possibility that data analytics offers to make the world a better place.
What is an analytical method: An analytical method is a technique used to quantitatively or qualitatively determine the concentration or properties of a molecule in a sample. It typically involves sample preparation by an analyst, followed by the analysis of the sample using specialized equipment or techniques.
What is Shiny: Shiny is an R package that allows users to build interactive web applications directly from R without the need for extensive web development skills. It provides an easy-to-use framework for creating interactive and responsive web apps for data visualization, exploration, and analysis, making it a powerful tool for data scientists and analysts.
Analytical methods play a crucial role in the pharmaceutical industry as they are used to determine the composition of samples. These methods typically involve sample preparation, such as centrifugation or heating, carried out by analysts or robots, followed by injecting the prepared sample into analytical equipment. The output from the equipment is usually a signal, such as millivolts or absorbance, which needs to be converted into a concentration that can be interpreted by humans, such as millimolars or percentages. This conversion requires (1) calibration samples of known concentration, (2) fitting an appropriate statistical model to establish the relationship between the signal and the concentration and (3) using this relationship to convert, or back predict, the signal of unknown samples into a concentration (Figure 1).
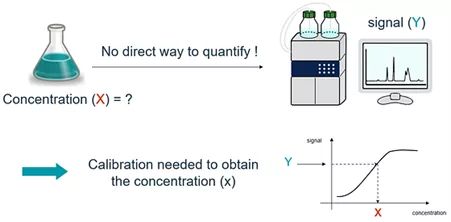
Figure 1: A calibration is needed to convert a signal into a concentration. The HPLC drawing is from DataBase Center for Life Science (DBCLS), distributed under a CC BY 4.0 license.
While simple linear models can be fitted using Excel, more advanced models may require specialized statistical software, which can be challenging for less experienced users to access and utilize. At Pharmalex, we love R-Shiny and we have developed an R-Shiny application called Back-PredicteR to address this challenge.
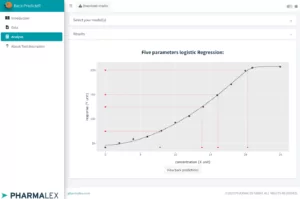
Figure 2: Screenshot of Back-PredicteR
Back-PredicteR is a user-friendly application written in R-Shiny that allows users to quickly fit various models commonly used in the analytical world (see the list below) to calibration data and back predict the concentration of their samples of interest from the acquired signal. With its intuitive interface, Back-PredicteR makes it easy for analysts to focus on the important questions rather than getting bogged down by technical details (Figure 2).
If you’re interested in trying Back-PredicteR, you can visit our custom software page at https://www.pharmalex.com/pharmalex-services/custom-software-development/
Conclusion
Calibration and back prediction are routine tasks in laboratories, and Back-PredicteR offers a streamlined and user-friendly solution for fitting advanced models and predicting sample concentrations from signals. However, it’s important to note that choosing the right calibration model is just the first step in analytical method development, as there are other aspects such as sample preparation optimization and qualification/validation of the analytical method that also need to be considered. If you have any questions or would like to discuss further, please don’t hesitate to contact us!
Appendix
List of models available in Back-PredicteR:
1. Linear regression
2. Weighted (1/X) linear regression
3. Weighted (1/X2) linear regression
4. Linear regression after (base 10) LOGARITHM transformation of both concentration and response
5. Linear regression after SQUARE ROOT transformation of both concentration and response
6. Quadratic regression
7. Weighted (1/X) Quadratic regression
8. Weighted (1/X2) Quadratic regression
9. Four parameters logistic regression
10. Weighted (POM) Four parameters logistic regression
11. Five parameters logistic
12. Weighted (POM) Five parameters logistic regression
13. Power regression
14. Weighted (POM) Power regression